
A practical guide for facility managers, hotel operators, and building owners who want to make their MEP engineering drawings searchable with AI — including real accuracy benchmarks from DXF, SVG, and PDF floor plan analysis.
Your engineering team has a stack of mechanical floor plans — PDFs, DXF files, maybe some dusty printed drawings in a binder. When a guest complains that Treatment Room 5 is too cold, someone has to dig through those plans, find the right floor, locate the room, and figure out which Fan Coil Unit (FCU) controls the temperature in that room.
That process takes 10–30 minutes. It should take 10 seconds.
We recently built a system for a hotel group that does exactly that. An engineer types “What FCU controls Treatment Room 5?” and gets the answer back instantly: FCU-8-4. No scrolling through drawings. No guessing. No calling the colleague who “knows the building.”
This article explains how AI-powered engineering drawing analysis works, what it takes to build one for a real building, and where the technology stands today. If you manage facilities for hotels, hospitals, commercial buildings, or campuses — this is the practical guide you didn’t know you needed.
Table of Contents
The Problem: Your Building Knowledge Is Trapped in Drawings
Engineering drawings contain everything about how a building works — which equipment serves which room, how ductwork connects systems, where electrical panels feed circuits, and how plumbing routes run through floors.
But that information is locked inside static images. To extract a single fact — like which FCU serves a specific room — a trained engineer needs to visually trace ductwork across a dense floor plan, follow leader lines from equipment labels, and mentally cross-reference room numbers with equipment schedules.
This works when you have experienced staff who know the building by heart. It breaks down when:
- Staff turnover means institutional knowledge walks out the door
- A building has 15+ floors with hundreds of rooms and thousands of equipment items
- Emergency situations require instant answers, not 20-minute drawing reviews
- Multiple properties need to be managed from a central operations team
The hospitality industry feels this acutely. Hotels operate around the clock, and HVAC issues in guest rooms or spa facilities can’t wait for the one engineer who memorized the mechanical plans.

What “AI for Engineering Drawings” Actually Means
Let’s cut through the marketing. When vendors say “AI for engineering drawings,” they usually mean one of three things:
1. Automated takeoffs and estimating — counting duct runs, measuring pipe lengths, and generating material lists from construction plans. This is the most mature category, and companies like Togal and Beam AI handle it well.
2. Clash detection and design review — finding conflicts between MEP systems (a duct running through a structural beam, for example). This typically requires 3D BIM models, not 2D drawings.
3. Knowledge extraction and querying — turning the information in engineering drawings into a searchable database so anyone can ask questions in plain language. This is what we built, and it’s the least explored category.
The first two are well-served by existing tools. The third is where the real gap is — and where facility managers get the most value. You don’t need to count duct fittings. You need to know which FCU serves which room, which circuit breaker controls which light, and which valve isolates which section of pipe.
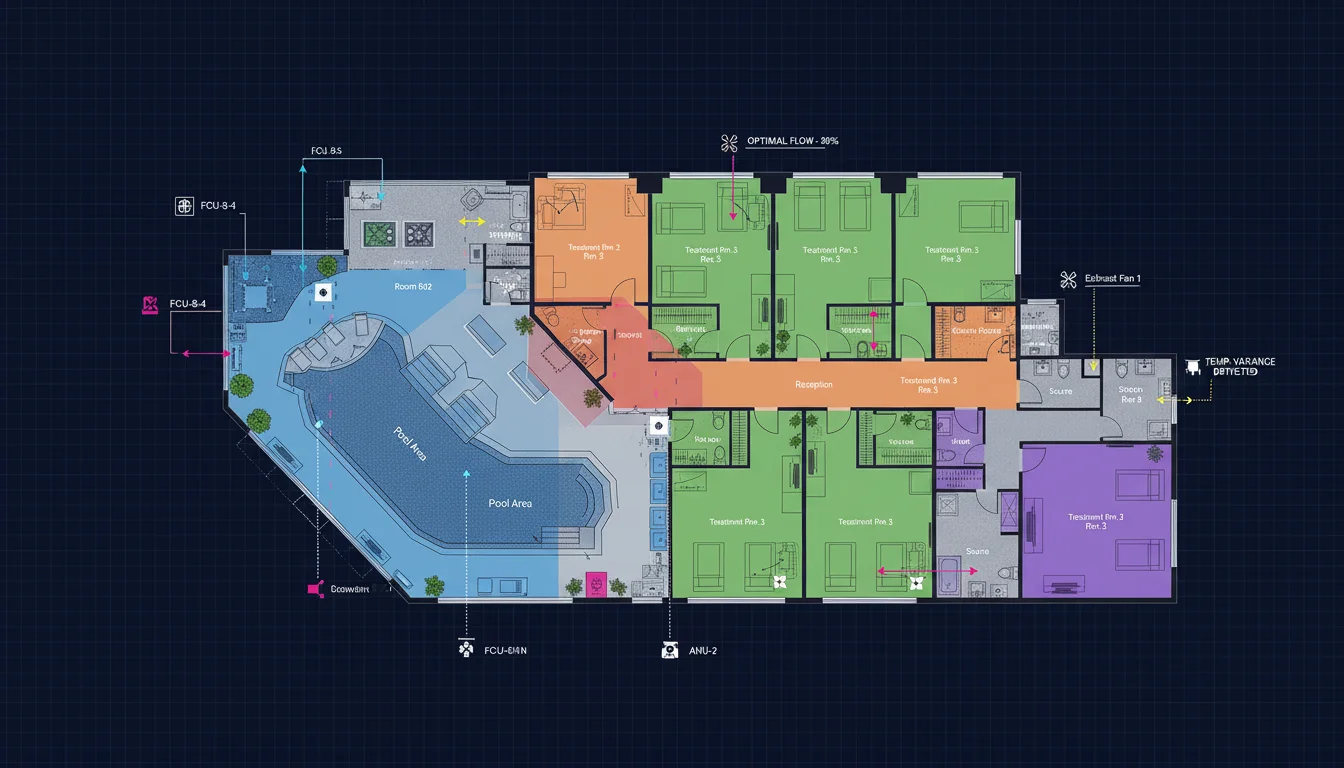
How We Built It: AI HVAC Floor Plan Analysis for a Hotel Spa
Our client operates a luxury hotel with a spa floor containing over 40 rooms — treatment rooms, locker rooms, a pool/lounge area, sauna, steam room, prep rooms, and back-of-house corridors. Some of these rooms have curved walls. Some share ceiling plenums with adjacent spaces. The mechanical plan includes 14 FCUs, dozens of supply diffusers, exhaust grilles, and a dense network of ductwork.
The goal was simple: let any engineer ask natural language questions about the HVAC system and get accurate answers, without ever opening a PDF.
Here’s how we did it.
Ready to Make Your Floor Plans Searchable?
Send us one floor plan and we’ll show you a working demo with your actual building data. No commitment required.
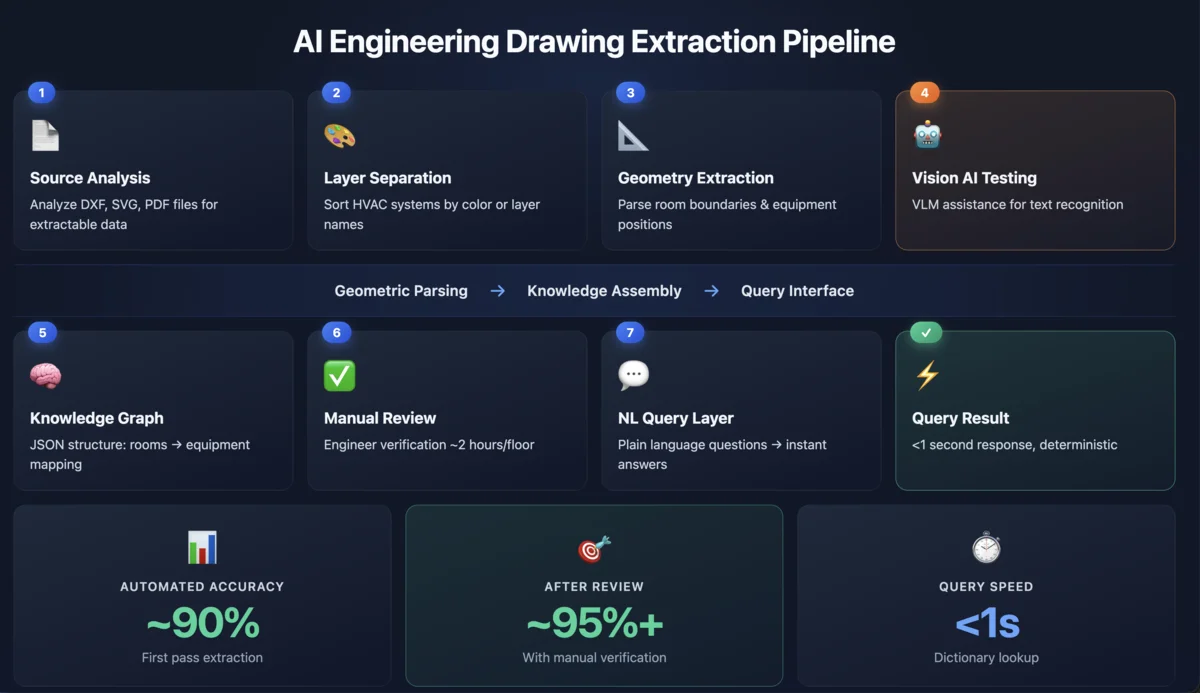
Step 1: Source File Analysis — Understanding What You’re Working With
Before writing any code, you need to understand what information actually exists in your drawings. This is where most AI projects stumble — they assume the data is clean. It almost never is. (We go deep on this in the CAD File Quality section below — it’s the most important part of this article.)
We analyzed three types of source files for this project:
SVG floor plans (exported from PDF) preserved vector precision from the original CAD drawings. Text labels were partially extractable, but fragmented — a label like “FCU-8-4” was split across multiple elements (“FCU”, “-“, “8”, “-“, “4”), each positioned separately on the canvas.
DXF files (exported from KOMPAS CAD) contained 52,000+ entities but had a critical problem: all text was “exploded” into polylines. Room names like “Treatment Room 5” weren’t stored as readable text — they were stored as hundreds of tiny line segments arranged to look like characters. The file had zero TEXT entities across its entire 52,594-entity count.
The DXF also used only one layer (everything on layer 0) and contained 7 anonymous blocks (U0 through U6) with zero attributes. No equipment metadata, no room assignments, no structured data of any kind.
The key takeaway: the quality of your source files determines 80% of your project outcome. We cover this in detail below, including a precision comparison table that shows the difference between well-authored CAD files (80–90% automated accuracy) and what we actually had to work with (40%).
Step 2: Layer Separation — Sorting Signal from Noise
Engineering drawings overlay multiple systems on a single sheet. On our hotel spa plan, architectural walls, HVAC ductwork, supply/return air systems, and exhaust systems were all drawn on top of each other.
We separated them using the only structural signal available: color.
- Color 7 (30,000 entities) = architecture and walls
- Color 5 (9,000 entities) = supply air ductwork
- Color 13 (11,000 entities) = return air
- Color 1 (2,400 entities) = exhaust
In better-authored files, you’d use layer names like A-WALL, M-DUCT-SUPPLY, E-LIGHT for this. But even color-based separation gave us a clean foundation: we could render each system independently, see equipment in isolation, and avoid the visual clutter that confuses both humans and AI models.
Step 3: Geometry Extraction — Finding Rooms and Equipment
This is the computational geometry stage. We needed two things: where are the room boundaries, and where is each piece of equipment located?
Room boundaries were extracted by parsing wall paths — thick strokes in the SVG/DXF that form closed polygons. Rectangular rooms were straightforward. The curved corridor and arch-shaped sauna/steam rooms required fitting circles to scattered wall points using least-squares regression.
Equipment positions were found by tracing leader lines — the thin lines with arrowheads that point from text labels to the equipment they describe. Each arrowhead tip represents the physical location of the equipment on the floor plan. We matched reconstructed text labels to their nearest arrowhead tips using a bipartite scoring algorithm to avoid greedy misassignment.
The result: a coordinate map of every FCU, exhaust grille, and supply diffuser, with its label and physical position.
Step 4: Vision LLM Testing — What We Learned from Qwen Models
One of the first approaches we tried was the most intuitive one: give a vision AI model the floor plan image and ask it to read the equipment labels directly. If it works, you skip the entire geometry parsing pipeline. We tested two open-source vision language models (VLMs) that are considered among the best for document understanding tasks, and ran them self-hosted to keep building data private.
Qwen 2.5 VL 72B — the larger model with 72 billion parameters. This is a heavyweight: it requires significant GPU resources to run (multiple A100s or equivalent), but it’s one of the most capable open-source vision models available for dense technical document understanding. On our hotel spa mechanical plan, it achieved roughly ~25% precision when given a full floor plan image and asked to extract equipment-room mappings.
Qwen 3 VL 27B — the smaller, more practical model at 27 billion parameters. It runs on more accessible hardware (a single A100 or even high-end consumer GPUs), which makes it attractive for self-hosted deployments. On the same floor plan, it achieved roughly ~20% precision.
For comparison, our geometric SVG parser — no AI involved, pure coordinate math — achieved ~40% precision on the same data, and ~95%+ after one pass of manual correction.
Why the vision models struggled:
The failure modes were consistent and instructive:
Dense text areas caused misreads. When multiple equipment labels sat close together on the plan — which is common in corridor zones where ductwork from several rooms converges — the models would misattribute labels to the wrong rooms, swap digits in equipment IDs (reading “FCU-8-4” as “FCU-8-9”), or merge adjacent labels into nonsense strings.
Full-plan images lost detail. A complete floor plan for a 45-room spa floor, rendered as a single image, contains thousands of text labels, symbols, and line types. At the resolution needed to fit the entire plan in the model’s input window, individual characters become too small for reliable recognition. The models see the spatial layout but can’t read the fine print.
Leader lines and visual conventions were ignored. Engineering drawings use specific visual conventions that human engineers learn through training — leader lines point from labels to equipment, different colors indicate different systems, hatching patterns show material types. The VLMs treated these as generic image features rather than structured information carriers. A leader line connecting “FCU-8-4” to its physical location was just another line in the image, not a meaningful pointer.
Inconsistent results across runs. The same question on the same image would sometimes produce different answers. Even with temperature set to 0 (the most deterministic setting), the models’ interpretation of spatial relationships was unstable. For a facility management system where engineers need to trust the answer, this inconsistency is a dealbreaker.
The tiling strategy: significant improvement, but not enough.
We found that accuracy improved meaningfully when we stopped sending the full plan and instead tiled it into smaller zones — roughly one room at a time, about 3000×3000mm in CAD coordinates or 512×512 pixels on screen. In this mode, the models could read individual labels more reliably because there were fewer competing elements in the image.
We also improved results by structuring the prompt carefully. Instead of asking “What FCU serves this room?” (which requires the model to reason about spatial relationships), we broke the task into steps: first “List all FCU labels visible in this image,” then “For each FCU, which room boundary contains it?” This two-step approach reduced errors from the model trying to solve the entire problem in one pass.
But even with optimized tiling and structured prompts, the vision models couldn’t match the precision of direct geometric parsing. The fundamental issue is that engineering drawings encode information through spatial conventions that VLMs don’t inherently understand. A leader line with an arrowhead means “this label refers to the object at the arrow tip.” A vision model sees the line and the text and the arrowhead, but doesn’t know the connection rule.
The architectural insight: extract once, query forever.
This testing led us to the key architectural decision that shaped the entire project. Instead of using a vision model at query time — where an engineer asks a question and the system re-analyzes the drawing image — we moved all the extraction work to a one-time ingestion step.
During ingestion, the drawing is parsed (geometrically or with VLM assistance) into a structured knowledge base. Every subsequent query hits the knowledge base directly — a dictionary lookup that takes milliseconds, not the 10–30 seconds a VLM needs to process an image.
For the query layer itself, a large vision model is massive overkill. We built the final system prompt at under 1,000 tokens — just the structured knowledge base in JSON format plus a few formatting rules. A small text-only model (even a 3B parameter model like Qwen 2.5 3B or Llama 3.2 3B) can handle the natural language understanding part: mapping “Treatment room 5” to “Treatment Rm. 5” and looking up the answer. Temperature set to 0 for deterministic responses. Response time under 1 second.
The vision models still have a role — they’re useful for initial text recognition from rendered tiles during the ingestion phase, especially when dealing with scanned drawings or PDFs where text isn’t extractable as data. But they’re a preprocessing tool, not the answer engine.
| Approach | Precision | Speed per Query | Consistency |
|---|---|---|---|
| Qwen 2.5 VL 72B (full plan) | ~25% | 10–30 sec | Inconsistent |
| Qwen 3 VL 27B (full plan) | ~20% | 5–15 sec | Inconsistent |
| Qwen VL + tiling + structured prompts | ~35–40% | 5–10 sec per tile | Better, still variable |
| SVG geometry parser (no AI) | ~40% | N/A (one-time) | Deterministic |
| SVG parser + manual review | ~95%+ | N/A (one-time) | Deterministic |
| Knowledge base lookup at query time | 100% (of KB) | <1 sec | Fully deterministic |
Step 5: Knowledge Graph Assembly
We combined all the extraction outputs into a single knowledge base — a JSON structure that maps every room to its equipment:
Room: "Treatment Rm. 5" (Room 812)
  └── FCU: FCU-8-4

Room: "Men's Changing Room" (Room 806)
  └── FCU: FCU-8-7

Room: "Pool Deck" (Room 819)
  └── FCU: FCU-8-2, FCU-8-11, FCU-8-13
Each entry includes the room name, room number, equipment IDs, equipment types, and spatial coordinates. This is the “digital brain” — a structured database that any query system can search.
Step 6: Manual Review and Correction
Here’s the honest part: the automated extraction produced about 40% accuracy on the first pass for a cold floor plan.
The main error sources were:
- Label fragmentation — text characters split across multiple SVG elements that our parser failed to reassemble correctly
- Equipment near room boundaries — an FCU in the ceiling plenum above the corridor that actually serves the adjacent treatment room
- Non-rectangular geometry — curved walls and arch-shaped rooms that didn’t fit axis-aligned bounding boxes
After one manual review pass — an engineer spending about 2 hours verifying and correcting the automated output for a single floor — accuracy reached near 100%.
Is this acceptable? For most facility management applications, absolutely yes. A 2-hour setup per floor, done once, produces a permanently searchable knowledge base. That’s a fraction of the time engineers currently spend answering ad-hoc questions about the building.
Step 7: Natural Language Query Layer
With the knowledge base built, the final step was trivially simple. An engineer types a question. The system normalizes the room name (“Treatment room 5” → “Treatment Rm. 5”), looks up the knowledge base, and returns the answer.
No complex AI is needed for the query itself. It’s a dictionary lookup. The AI did its heavy lifting during extraction. The query layer is just a clean interface on top of structured data.
For more complex questions — “trace the supply duct path from FCU-8-4 to the room it serves” — a small language model can synthesize the answer from the knowledge base context without ever looking at the drawing.

Can AI Read Engineering Drawings?
Yes — but not the way most people expect.
If you’re imagining uploading a PDF floor plan to ChatGPT and getting a list of every piece of equipment and which room it serves, that’s not how it works today. We tested the best available open-source vision AI models — Qwen 2.5 VL (72 billion parameters) and Qwen 3 VL (27 billion parameters) — on real HVAC mechanical plans, and accuracy on a full dense drawing topped out at around 25%.
The practical approach that actually works for engineering drawing data extraction is a hybrid: parse the drawing file directly (SVG, DXF, or DWG) for coordinates, room boundaries, and equipment positions using computational geometry, then use AI only for the parts that require natural language understanding — like mapping a question phrased as “Treatment room 5” to the canonical label “Treatment Rm. 5” in the knowledge base.
The AI floor plan analysis pipeline we built achieves near-100% accuracy after a single manual review pass, responds to queries in under 1 second, and produces fully deterministic results. Compare that to a vision model that takes 10–30 seconds per query and gives different answers each time.
For a detailed breakdown of how each approach performed, see Step 4 in the case study above.
CAD File Quality: The Single Biggest Factor in Engineering Drawing Data Extraction
This is the section most articles about AI and engineering drawings skip entirely. They show you a polished demo and imply the AI “just reads” your drawings. In reality, the format and authoring quality of your CAD files determines whether automated extraction takes days or weeks — and whether you get 80% accuracy or 40%.
We’ve analyzed real CAD files from multiple sources. Here’s what we found, with actual numbers.
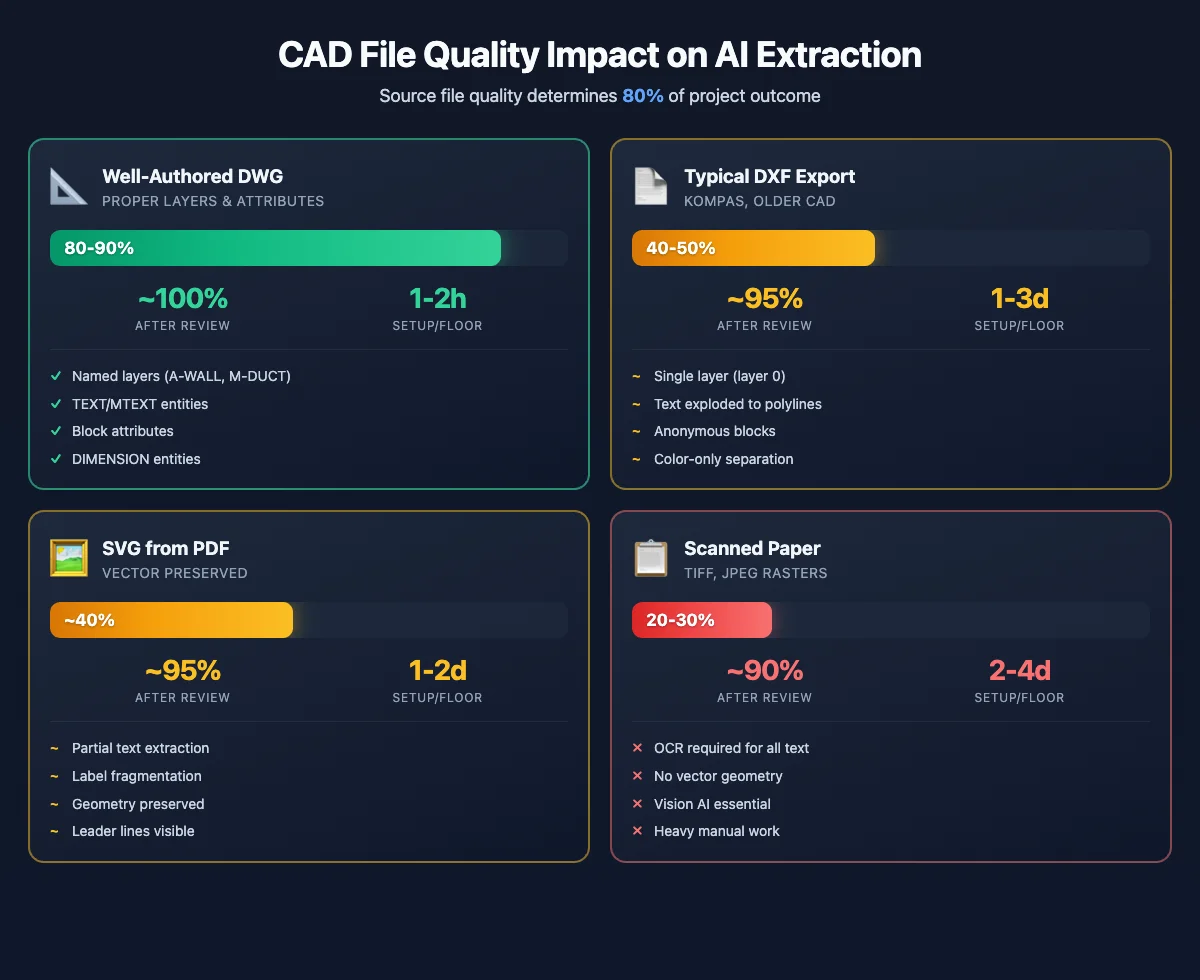
Well-Authored DWG/DXF: ~80–90% Automated Accuracy
Get a Free Analysis of Your Floor Plan
Upload one mechanical floor plan and we’ll demonstrate what’s possible with your specific drawings.
When a CAD operator follows best practices, the resulting DWG or DXF file is essentially a structured database disguised as a drawing. Here’s what “well-authored” means in practice:
Named layers separate building systems cleanly. Instead of dumping everything on layer 0, the drawing uses names like A-WALL for architectural walls, M-DUCT-SUPPLY for supply air ductwork, M-FCU for fan coil units, E-LIGHT for lighting fixtures, and P-PIPE for plumbing. An AI extraction system can read these layers directly — walls on one layer, equipment on another, ductwork on a third. No guesswork needed.
TEXT and MTEXT entities store room names and equipment IDs as actual text data, not as shapes that look like letters. When your drawing contains a MTEXT entity that says “FCU-8-4,” a parser can read it as a string in milliseconds. No OCR, no vision model, no ambiguity.
Block attributes attach structured metadata to equipment symbols. A well-authored FCU block might include attributes like EQUIPMENT_ID = “FCU-8-4”, SERVES_ROOM = “812”, AIRFLOW_CFM = “400”, and CIRCUIT = “LP-8A-3”. If your drawings have this level of detail, you essentially get the knowledge graph for free — it’s already embedded in the CAD file.
DIMENSION entities provide structured measurement data — wall lengths, room sizes, duct dimensions. These are machine-readable numbers, not drawn approximations.
With files like these, automated extraction can reach 80–90% accuracy without any vision AI at all. The remaining 10–20% typically comes from equipment that serves a different room than the one it’s physically located in (an FCU in a ceiling plenum above a corridor that actually conditions the adjacent treatment room). A quick manual review brings accuracy to near 100%.
Estimated setup time per floor: 2–5 hours (mostly verification, minimal correction).
Typical DXF Exports: ~40–50% Automated Accuracy
This is what we actually encountered in our hotel project, and it’s far more common than the ideal scenario above.
Our client’s drawings were exported from KOMPAS — a CAD platform widely used in Eastern Europe and CIS countries. The DXF file was technically a modern format (AC1032, AutoCAD 2018 compatible), but the way it was authored created serious obstacles:
Everything lived on a single layer (layer 0). The 52,594 entities in the HVAC mechanical plan — walls, ductwork, equipment symbols, text labels, dimension lines — were all on the same layer. There was no way to tell a wall from a duct from an FCU symbol using layer information alone. We had to fall back to color-based separation: color 7 for architecture (30,000 entities), color 5 for supply air (9,000 entities), color 13 for return air (11,000 entities), and color 1 for exhaust (2,400 entities). It worked, but color is a far weaker signal than layer names.
All text was exploded into polylines. This was the single biggest problem. In KOMPAS, when drawings are exported to DXF, text characters are often converted from editable TEXT/MTEXT entities into hundreds of tiny line segments (LWPOLYLINE entities) that visually form letters on screen but contain zero text data. The label “FCU-8-4” that should be a single readable string becomes approximately 200 polyline segments arranged to look like characters. A parser can’t read them. A standard OCR tool struggles because these aren’t raster images — they’re vector shapes. Even the DXF file had zero TEXT entities across its entire 52,594-entity count.
Blocks were anonymous and had no attributes. The drawing contained 7 block definitions (named U0 through U6 — anonymous, auto-generated names), and none of them carried any attributes. No EQUIPMENT_ID, no SERVES_ROOM, no metadata at all. The blocks were just collections of geometry, not structured data containers.
No XDATA (extended data). Some CAD tools embed application-specific metadata in XDATA fields — equipment specifications, system assignments, manufacturer data. This DXF had none.
We also analyzed a second DXF file — an architectural floor plan from the same KOMPAS origin. It was smaller (966 entities, 4.7 MB) and told a slightly different story. It contained 36 MTEXT entities with room labels like “BATH,” “BED ROOM,” and “T.V. LOUNGE,” 249 DIMENSION entities with wall measurements, and 17 block inserts with room names and sizes embedded as text within the block geometry (e.g., “BED ROOM 16′-6″×16′-0″”). So partial structure did exist — but the block insertion points were all at coordinate (0, 0), meaning the room labels couldn’t be placed on the floor plan programmatically. KOMPAS had exported the block definitions with geometry at local coordinates but didn’t encode proper insertion points.
The takeaway: even within the same CAD tool, different plan types (mechanical vs. architectural) can have dramatically different data quality. Don’t assume one good file means the rest will be good too.
Estimated setup time per floor: 1–3 weeks (significant parsing development + manual correction).
SVG from PDF Export: ~40% Automated, ~95%+ After Manual Review
Many facility teams don’t have DWG/DXF files at all — they have PDFs. Converting a PDF to SVG preserves vector precision from the original CAD drawing, which is a huge advantage over rasterized images.
In SVG, text labels are often partially extractable. In our hotel spa plan, character-level fragments appeared as SVG <path> elements with aria-label attributes — “FCU”, “-“, “8”, “-“, “4” as separate elements. We reconstructed full labels by grouping tokens at the same Y coordinate with close X proximity. This worked for about 70% of labels. The remaining 30% failed due to overlapping text, inconsistent spacing, or character fragments that our proximity algorithm couldn’t reliably group.
Room names appeared as compound text strings packed into single SVG <text> elements — like “TR. ROOM 2 806 TR. ROOM 8 811 TR. ROOM 3 807” — which required pattern-based parsing to separate individual room names from their numbers.
SVG also preserved geometric relationships that matter for spatial analysis: wall paths as thick strokes, leader lines as thin strokes connecting labels to equipment, arrowhead tips marking physical equipment locations. We used these geometric cues — including coordinate transforms that convert CAD space to screen space — to build the equipment-to-room mapping.
Estimated setup time per floor: 1–2 weeks (parsing + spatial assignment + manual verification).
Scanned Paper Drawings: Expect the Highest Cost
If your only source is scanned paper — photographed or flatbed-scanned engineering drawings stored as TIFF or JPEG files — every piece of information needs to be extracted via OCR and computer vision. Room names, equipment IDs, duct sizes, and flow rates all need to be recognized from pixel data, and the geometric relationships between elements must be inferred from image analysis.
This is where vision AI models add the most value, but accuracy is the lowest of all scenarios. Expect 20–30% automated accuracy on the first pass, with significant manual correction needed.
Estimated setup time per floor: 2–4 weeks (heavy manual verification required).
The Precision Comparison at a Glance
Here’s the real-world precision data from our project, broken down by source file quality:
| Source File Type | Automated Accuracy | After Manual Review | Setup Time/Floor | Key Bottleneck |
|---|---|---|---|---|
| DWG/DXF with proper layers, text, attributes | 80–90% | ~100% | 2–5 hours | Equipment in adjacent room’s ceiling plenum |
| DXF from KOMPAS (single layer, exploded text) | 40–50% | ~95%+ | 1–3 weeks | Text is polylines, not data |
| SVG from PDF export | ~40% | ~95%+ | 1–2 weeks | Label fragmentation, room boundary detection |
| Scanned paper drawings | 20–30% | ~90% | 2–4 weeks | Everything requires OCR/vision AI |
The gap between the first row and the rest is enormous. A well-authored CAD file gives you an 80%+ head start. A poorly authored one or a PDF export puts you at 40%, with weeks of additional work to close the gap.
What to Ask Your Design Team Before Starting
The single most impactful thing you can do before starting an AI drawing analysis project is ask your design consultants these five questions:
“Can you export DWG files with text preserved as TEXT/MTEXT entities, not exploded to polylines?” This one question determines whether your text extraction is trivial or a multi-week engineering problem.
“Are your drawings organized into named layers?” Layers like A-WALL, M-DUCT, M-FCU, E-PANEL let us separate building systems instantly. Everything on layer 0 means we’re guessing based on color or stroke width.
“Do your equipment blocks have populated attributes?” Block attributes like EQUIPMENT_ID and SERVES_ROOM give us the knowledge graph directly — no spatial analysis needed.
“What CAD software was used?” AutoCAD and Revit exports are the most predictable. KOMPAS, older MicroStation versions, and some regional CAD tools produce DXF files that technically conform to the format but lose critical data in translation.
“Can you export an equipment schedule as CSV or Excel?” This is the shortcut that bypasses the drawing entirely for structured data. If your CAD tool can export a table showing “FCU-8-4 serves Room 812,” you have the answer key — the drawing analysis just needs to verify it spatially.
Getting answers to these questions before a single line of code is written can cut your project timeline from weeks to days and your cost by 50% or more.
Automated Drawing Review: Where This Technology Stands in 2026
The AI-for-engineering-drawings space is maturing fast, but it’s important to understand what works today and what’s still emerging.
What works well right now: extracting structured equipment schedules from well-authored CAD files, counting and measuring elements for takeoffs, and building searchable knowledge bases from mechanical plans with human-in-the-loop verification.
What’s improving but not production-ready: fully automated extraction from any drawing without human review, cross-discipline tracing (following a circuit from a light switch through the electrical panel to the transformer), and handling drawings from diverse CAD tools with zero configuration.
What’s still aspirational: real-time “digital twin” integration where changes to the physical building automatically update the knowledge base, and multi-floor system tracing that follows ductwork from the penthouse to the plant room.
For facility managers evaluating this technology today, the practical advice is: start with your most critical building systems (usually HVAC mechanical), verify the extracted knowledge base with your engineering team, and expand floor by floor. A single building’s worth of mechanical plans can typically be processed and verified in 2–4 weeks, depending on source file quality.
AI Facility Management: Who Benefits Most?
Hotel groups with multi-property portfolios where engineering staff rotate between buildings and can’t memorize every floor plan.
Hospital facility managers where equipment uptime is critical and the answer to “which AHU serves the operating theater?” needs to be instant, not a 20-minute drawing review.
Commercial building owners with aging properties where the original engineering team is long gone and institutional knowledge has evaporated.
Property management companies taking on new buildings and needing to onboard their engineering teams quickly.
If your team spends more than an hour a week answering questions that could be answered by reading an engineering drawing — the ROI on a structured knowledge base is measured in weeks, not years.
Frequently Asked Questions
How accurate is AI at reading engineering drawings?
It depends heavily on your source file quality. With well-authored DWG/DXF files (proper layers, text entities, block attributes), automated extraction reaches 80–90% accuracy. With typical PDFs or poorly-exported DXF files, expect 40% automated accuracy, rising to 95%+ after one manual review pass per floor. Vision-only AI models (like Qwen 2.5 VL 72B) achieve around 25% on dense full-floor plans without geometric parsing support.
What file formats work best for AI drawing analysis?
DWG/DXF with named layers and un-exploded text are the gold standard. PDF-exported-to-SVG is a good second option — vector precision is preserved and text is partially extractable. Scanned paper drawings are the most expensive to process, requiring OCR and heavy manual correction. The single best thing you can do is ask your design team to export DWG files with text preserved as TEXT/MTEXT entities.
Can AI extract data from DXF and DWG files?
Yes, and this is actually the most reliable approach — far more reliable than trying to “read” a floor plan image with vision AI. DXF/DWG files contain structured geometry (coordinates, layers, blocks) that a parser like ezdxf can extract directly. The challenge is that many DXF exports — especially from tools like KOMPAS — have text exploded into polylines and everything on a single layer, which reduces the extractable data significantly.
How much does AI engineering drawing analysis cost?
A single floor with a well-authored DWG file can be processed and verified in 2–5 hours. A floor with PDF-only source files typically takes 1–2 weeks including manual review. For a full breakdown of AI development costs, see our guide: How Much Does It Cost to Build an AI Agent?
What’s the difference between AI drawing analysis and BIM?
BIM (Building Information Modeling) uses full 3D models with embedded data — equipment specifications, system relationships, and spatial coordinates are all part of the model. AI drawing analysis works with 2D drawings (the kind most existing buildings have) and extracts the same kind of structured data through geometric parsing and text recognition. If you have BIM/IFC files, you already have most of what our pipeline builds. If you only have 2D PDFs or DXFs — which is the reality for most facilities — AI drawing analysis bridges the gap.
Getting Started
If you’re considering AI-powered engineering drawing analysis for your facilities, here’s a practical first step: send us one floor plan — ideally a mechanical HVAC plan in PDF or DXF format — and we’ll analyze it, extract the equipment-room relationships, and show you a working demo of natural language queries against your actual building data.
No commitment, no pitch deck. Just a concrete demonstration of what’s possible with your specific drawings.
We’ve done this for hotel spa facilities with curved corridors, 40+ rooms, and 14 FCUs. We’ve handled CAD exports from KOMPAS, AutoCAD, and PDF-to-SVG conversions. And we’ve built the complete pipeline from raw drawing to queryable knowledge base.
Oleg Kalyta is the founder of ProductCrafters, a software development agency specializing in AI-powered products. His team builds custom AI solutions for facility management, healthcare, and real estate — from MVPs to production systems. Based in Portugal, working with clients across the US and Europe.